Shall we draw maths?
We have already seen
about graph paper. Graph papers help us a lot in learning about geometric
shapes and number lines.
We can't forget the
help that the graph paper made in learning about area.
It can be said that
mathematics and graphs not be separated.
It is the graph paper
that gives shape to mathematics, which is numbers. We'll see how it goes.
Before that you must be
familiar with graph paper. Let's compile them.
Let's draw a horizontal
line as the center of the graph paper. The horizontal line lying on this is
taken as the X axis.
In this we will note
the positive numbers (plus numbers) to the right of the central zero and the
negative numbers (minus numbers) to the left of zero.
Now let's establish a
vertical line through the zero of the horizontal line X axis? This vertical line
is called the Y axis.
The X axis cuts through
the center of this Y axis. From there let's note the positive numbers (plus
numbers) above the zero and the negative numbers (minus numbers) below the zero.
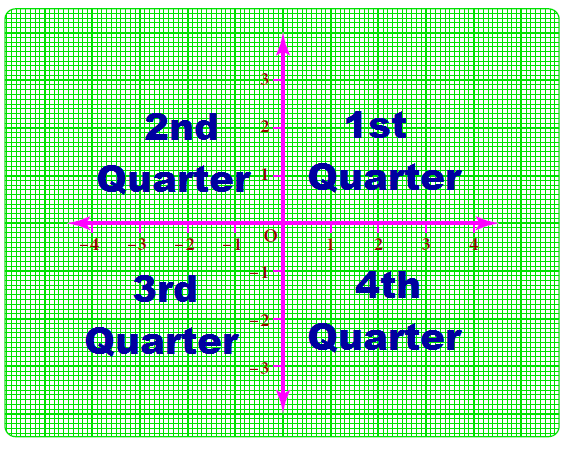
Now the horizontal line
and vertical line i.e. X axis and Y axis together divide the graph paper into
four parts?
These four quarters are
divided into first quarter, second quarter, third quarter and fourth quarter.
The first quadrant is
the area enclosed by the plus number lines of the X and Y axes.
The second quadrant is
the area enclosed by the negative number (minus number) line on the X axis and
the positive number (plus number) line on the Y axis.
The third quadrant is
the area enclosed by the negative number (minus number) line on the X axis and
the negative number (minus number) line on the Y axis.
The fourth quadrant is
the area bounded by the positive number (plus number) line on the X axis and
the negative number (minus number) line on the Y axis.
You can see this in the
picture below.
All you need to know is
how to mark the points. If two numbers are taken as a pair that is the marking
point of the graph paper.
For example take (2, 3)
which is a point. The first number of this point corresponds to the X axis and
the second number corresponds to the Y axis. That is, the point (2, 3) is where
the X-axis 2 and the Y-axis 3 meet. This point is located in the first quarter.
This is because both are positive numbers (plus numbers). The first quadrant is
bounded by the plus number lines of the two axes.
So if we take (-2, 3)
it will be in the second quarter. Because the first number of this point -2 is
negative number (minus number) we will take it on negative number (minus
number) line segment of X axis. Since the second number of point 3 is a
positive number (plus number) we take the positive number of the Y axis in the
line segment. The point where these two numbers meet is (-2, 3).
If we take the point
(-2, -3) since both the numbers of the point are negative numbers, then the
negative number of both axes is taken in the line segment, so the point will be
in the third quadrant.
If we take (2, -3) since
the first number 2 is a positive number (plus number) on the positive number
(plus number) line of the X axis and the second number -3 is a negative number
(minus number) it is taken on the minus number line of the Y axis so it is the
fourth quarter.
These are all your
well-known concepts.
The main benefit of
this graph paper, as I said earlier, is the shape it gives to numbers.
It is the graph number
that gives the numbers a form called a number line.
Now let's take the
table below that we saw in the proportionality?
|
Numerator |
1 |
2 |
3 |
4 |
5 |
6 |
7 |
8 |
9 |
10 |
|
Denominator |
4 |
8 |
12 |
16 |
20 |
24 |
28 |
32 |
36 |
40 |
Oh! Again
we are saying that it is a direct proportion. Aren't all math topics
interrelated?
What does the above
table indicate?
Let's say it represents
fractions, represents direct proportion, represents multiples, represents the
side and perimeter of a square. It can also be said that it indicates the
marking points on the graph paper.
You say so? Yes, that's
right.
Now take numerator as X
and denominator as Y. Oh yes, you say?
|
X |
1 |
2 |
3 |
4 |
5 |
6 |
7 |
8 |
9 |
10 |
|
Y |
4 |
8 |
12 |
16 |
20 |
24 |
28 |
32 |
36 |
40 |
Now if we
take a number from X and a number from Y, the points we need to mark are ready.
Before that, how do
these points lie, can we note that y = 4x? So all numbers in y are multiples of
4x? So the equation we have taken is correct?
Now let's look at the
points to be marked. That is, we take a number from X and a number from Y to
generate points.
(1, 4)
(2, 8)
(3, 12)
(4, 16)
(5, 20)
(6, 24)
(7, 28)
(8, 32)
(9, 36)
(10, 40)
Note these points on
the graph paper . Just connect the points.
The picture you see now
is the graph for a direct proportion that we created in the table. It is simply
a graph showing the relationship between the side size and the perimeter of a
square. It's just a graph showing multiples of four. That's just the graph for
the equation y = 4x.
Not only that, but it
is also a graph of functions as you will learn in the upper classes.
You will also learn
that any algebraic equation can be graphed like this on graph paper.
A graph sheet is a
basic tool of 2D i.e., two dimension. You will also understand that this
fundamental helps you to understand from 3D to n-Dimension.
Also take a table for
inverse ratio and note its points on the graph paper. You can also understand
how its graph is structured.
What's next? I
understand what you're asking.
We are almost at the
end of easy maths. Before that, I think we can conclude by talking about
statistical basic measures of central or representative value.
*****
No comments:
Post a Comment